
Use Cases
What live production telemetry reveals about your code.
Examples of issues that only became visible once actual traffic was in the picture, and how Bluebox helped surface and investigate them.
01 From alert to investigation to fix, without the manual handoff.
From production alert to root cause in 10 minutes.
Problem Production alert fired on the payment service. No visibility into what caused it.
What Bluebox did Detected the incident, ran automated RCA, filed a GitHub Issue with full investigation. Coding agent generated the fix.
Result 10 min to root cause ~1 hr the manual way
From alert to investigation to fix, without the manual handoff.
From production alert to root cause in 10 minutes.
Production alert fired on the payment service. No visibility into what caused it.
Detected the incident, ran automated RCA, filed a GitHub Issue with full investigation. Coding agent generated the fix.
Problem
A production alert fires on the EasyTrade payment service. The typical flow: developer dives through logs, forms theories, rules them out, then explains all that context to a coding agent. By the time the agent starts, the developer has already done most of the hard work.
What Bluebox did
- 1 Bluebox detected the incident from live telemetry: an arithmetic error in the payment service triggered by a feature flag enabled in the deployment.
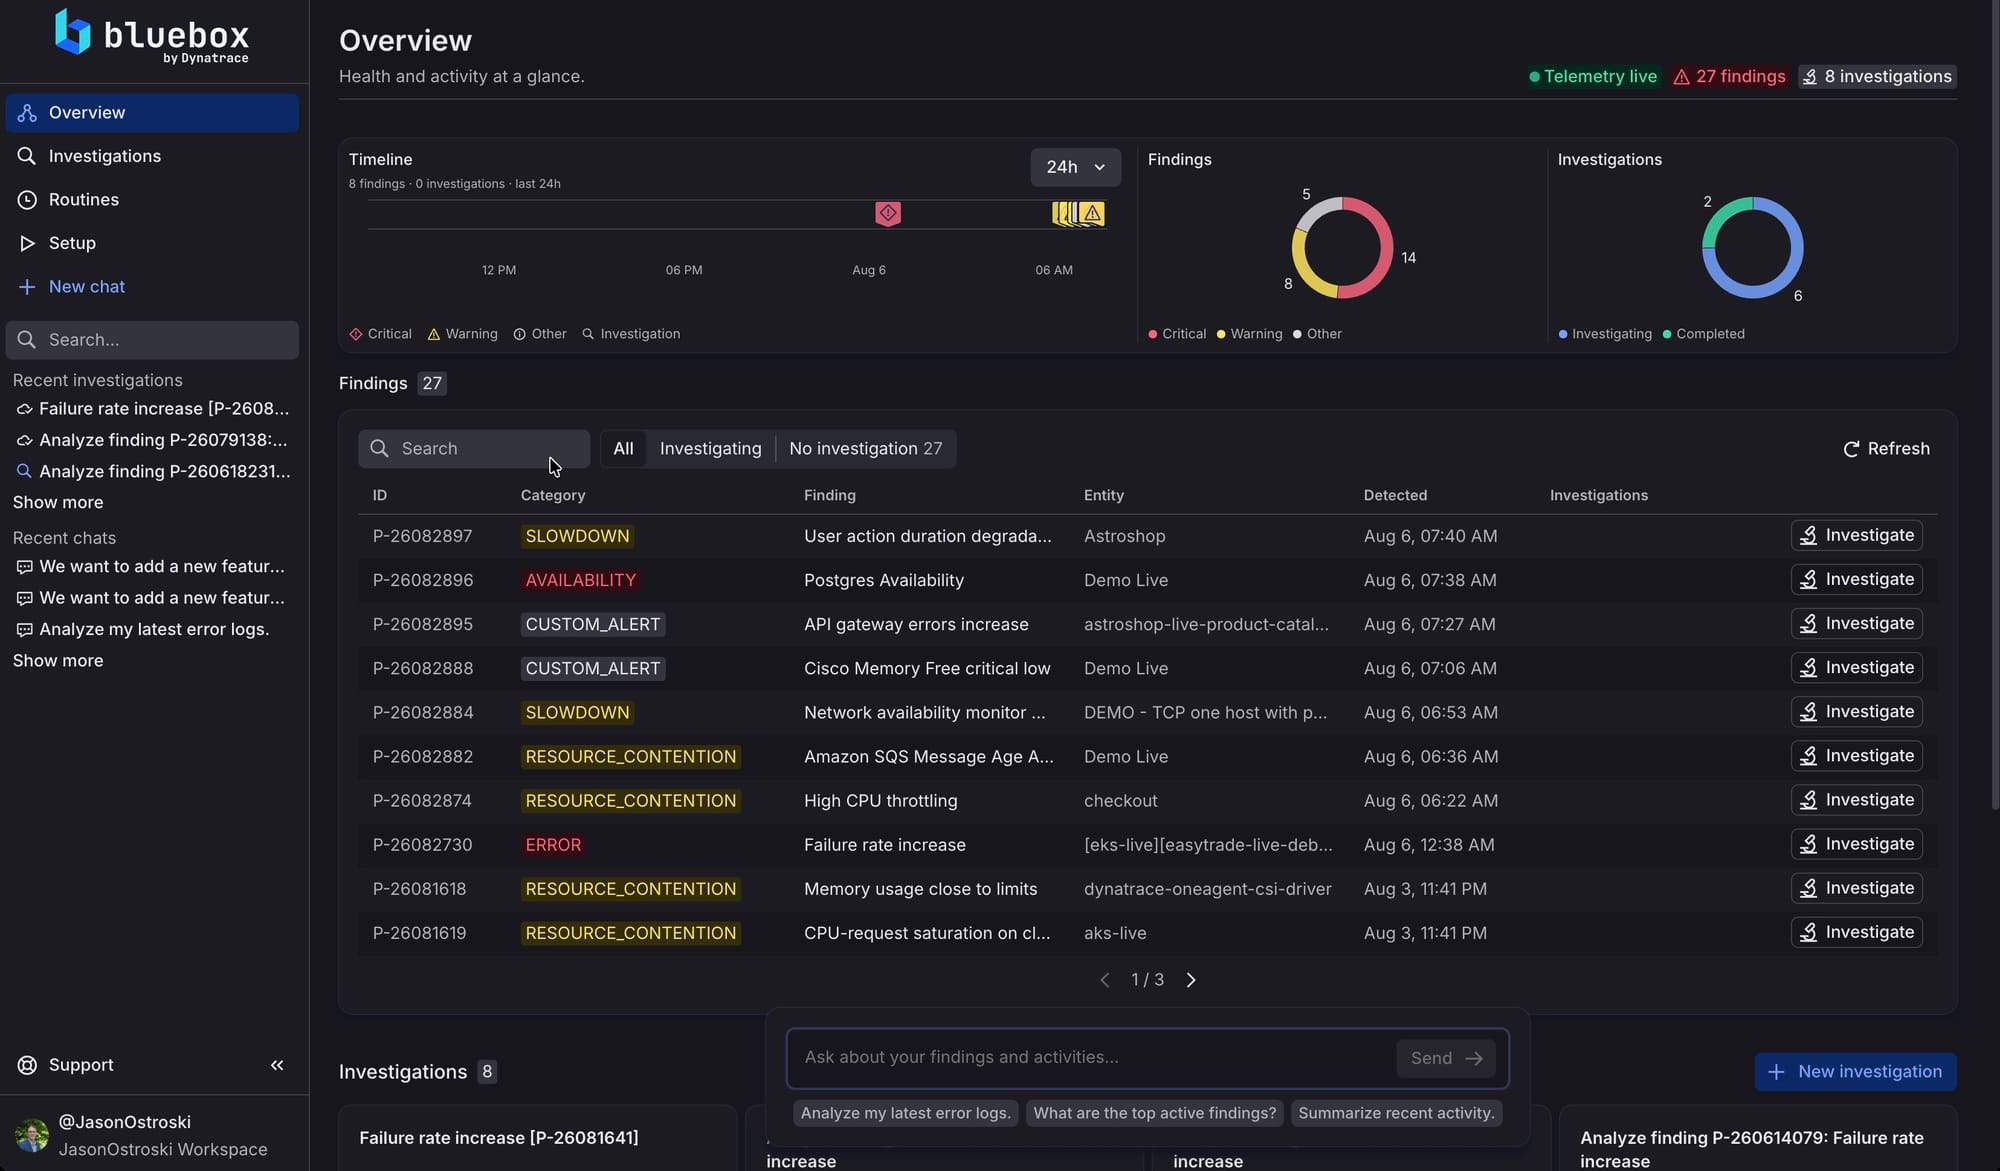
- 2 Ran automated root cause analysis: gathered situational context, formed and tested hypotheses against live spans, assembled evidence. Every affected transaction traced back to the same code issue.
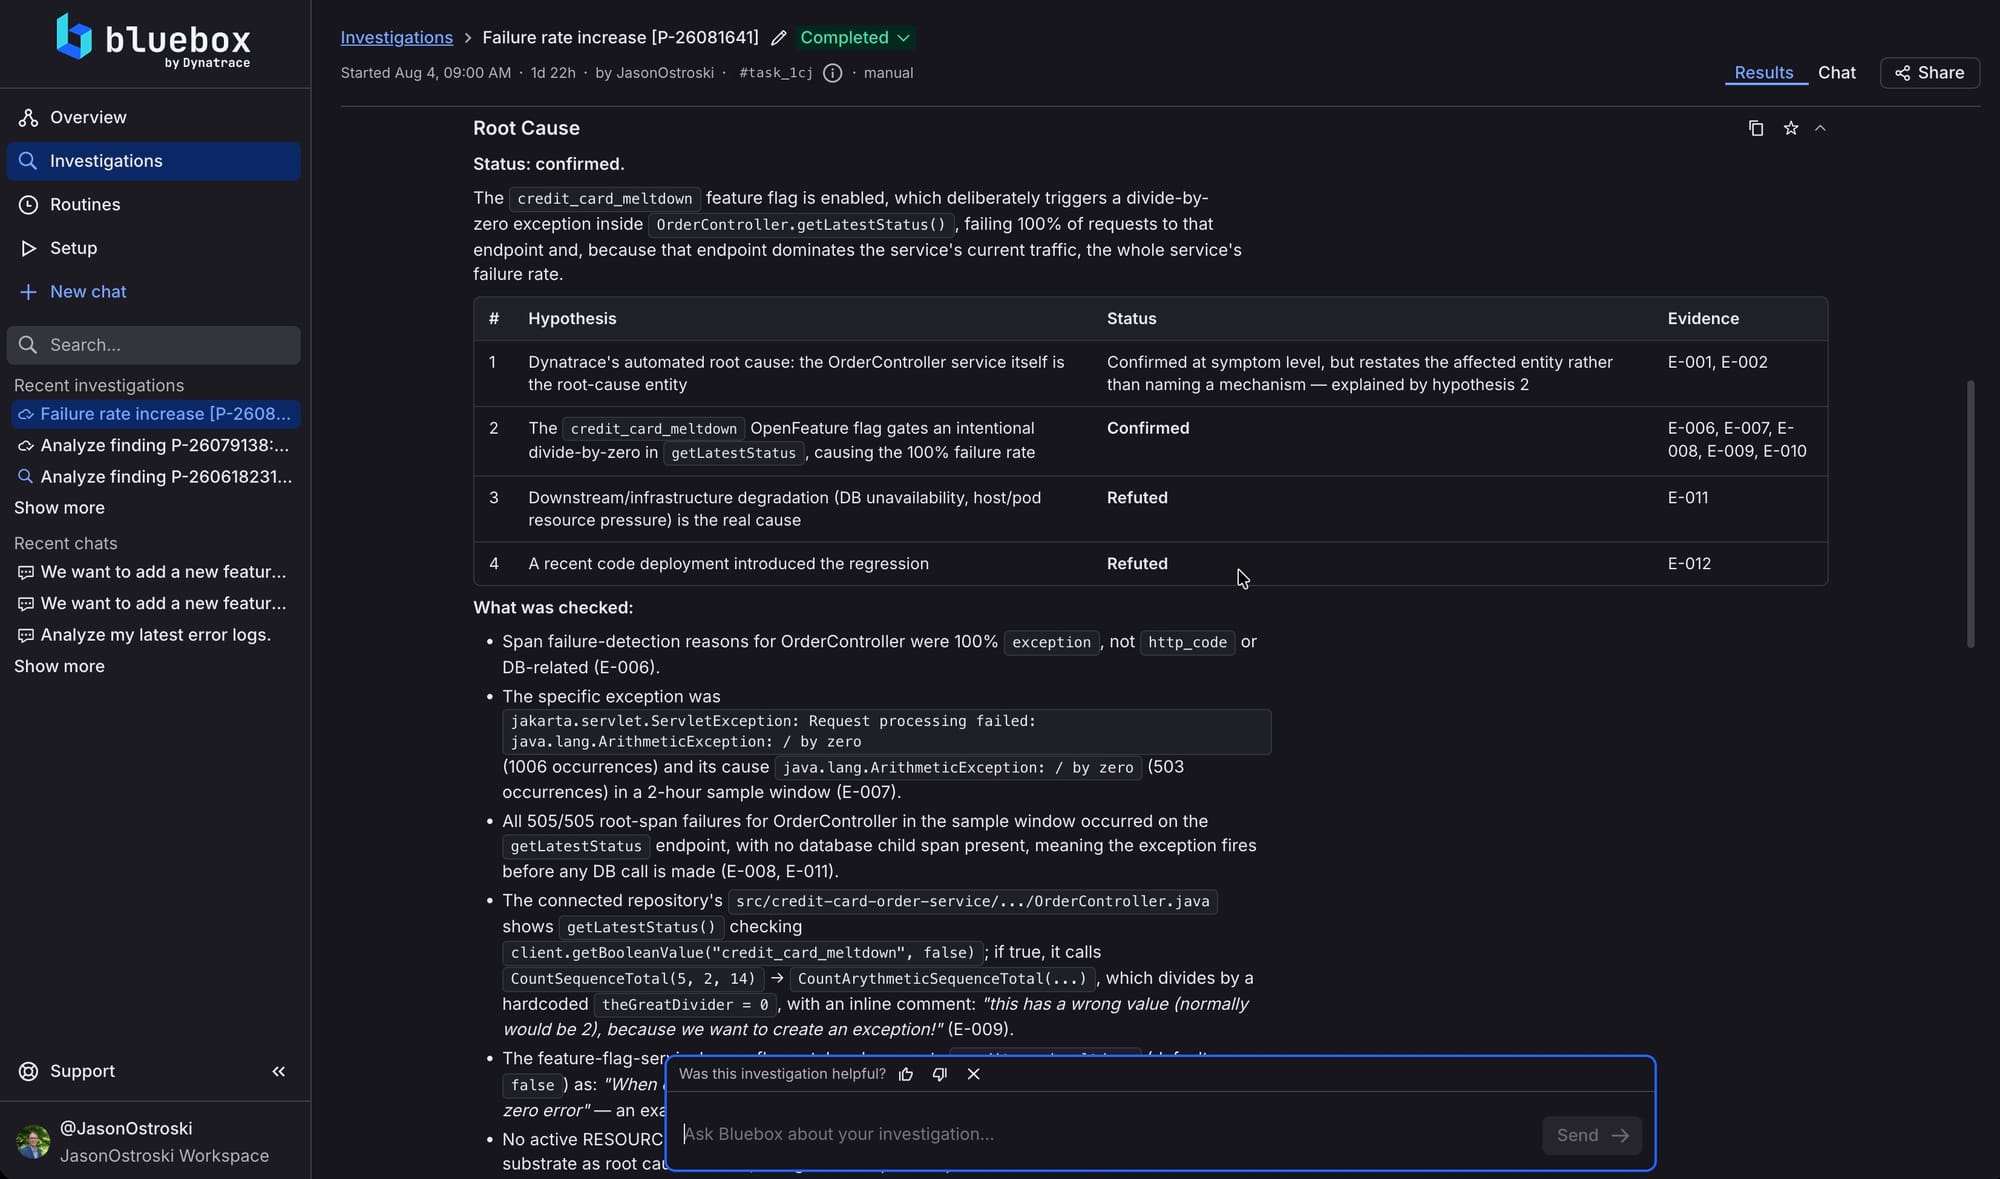
- 3 Filed a GitHub Issue with the full investigation output. No manual briefing required. The coding agent had everything it needed to generate a fix.
- 4 Coding agent (Claude Code / Kiro) picked up the GitHub Issue and generated a fix with full production context already in hand.
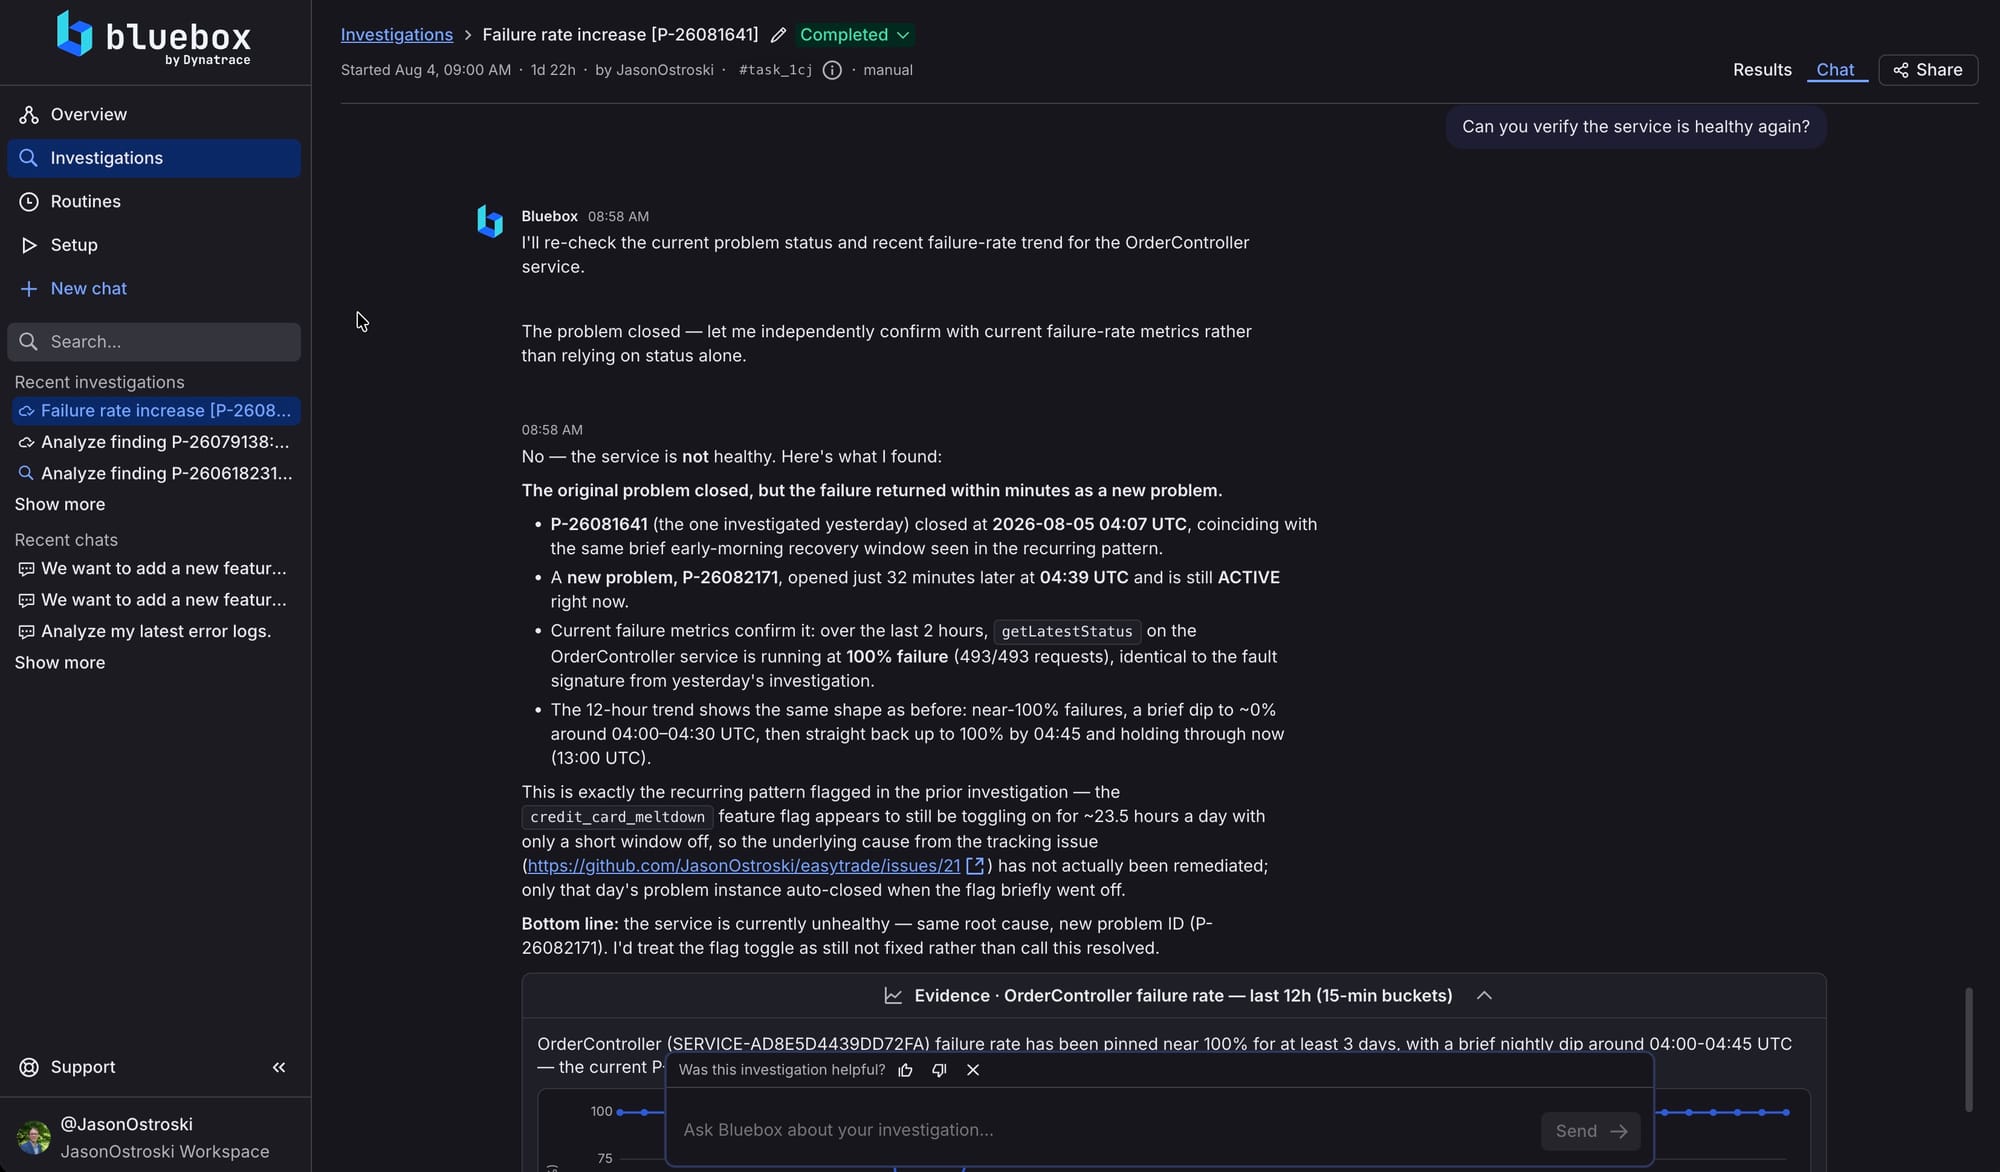
- 5 Bluebox monitored post-deploy and found the problem was still recurring on a schedule. The fix didn't hold.
Result
02 Find performance issues that only appear under real load
p99 went from 45ms to 870ms. Local testing showed nothing.
Problem One new line of code. p99 latency spiked 19x post-deploy.
What Bluebox did 3 queries traced the spike to lock contention on a hot row.
Result Root cause found in 3 queries fix options surfaced
Find performance issues that only appear under real load
p99 went from 45ms to 870ms. Local testing showed nothing.
One new line of code. p99 latency spiked 19x post-deploy.
3 queries traced the spike to lock contention on a hot row.
Problem
Michael added a last_activity_at timestamp write to an account activity endpoint. One UPDATE statement, sub-millisecond locally. It passed code review and deployed. Post-deploy, p99 latency spiked from 45ms to 870ms and 22% of all requests exceeded 500ms. Lock contention doesn't show up in local testing. It only surfaces under real traffic on a live database.
What Bluebox did
- 1 First query: found 900ms of wait time inside db.transaction before the query even started. Queue-wait from lock contention, not execution time.
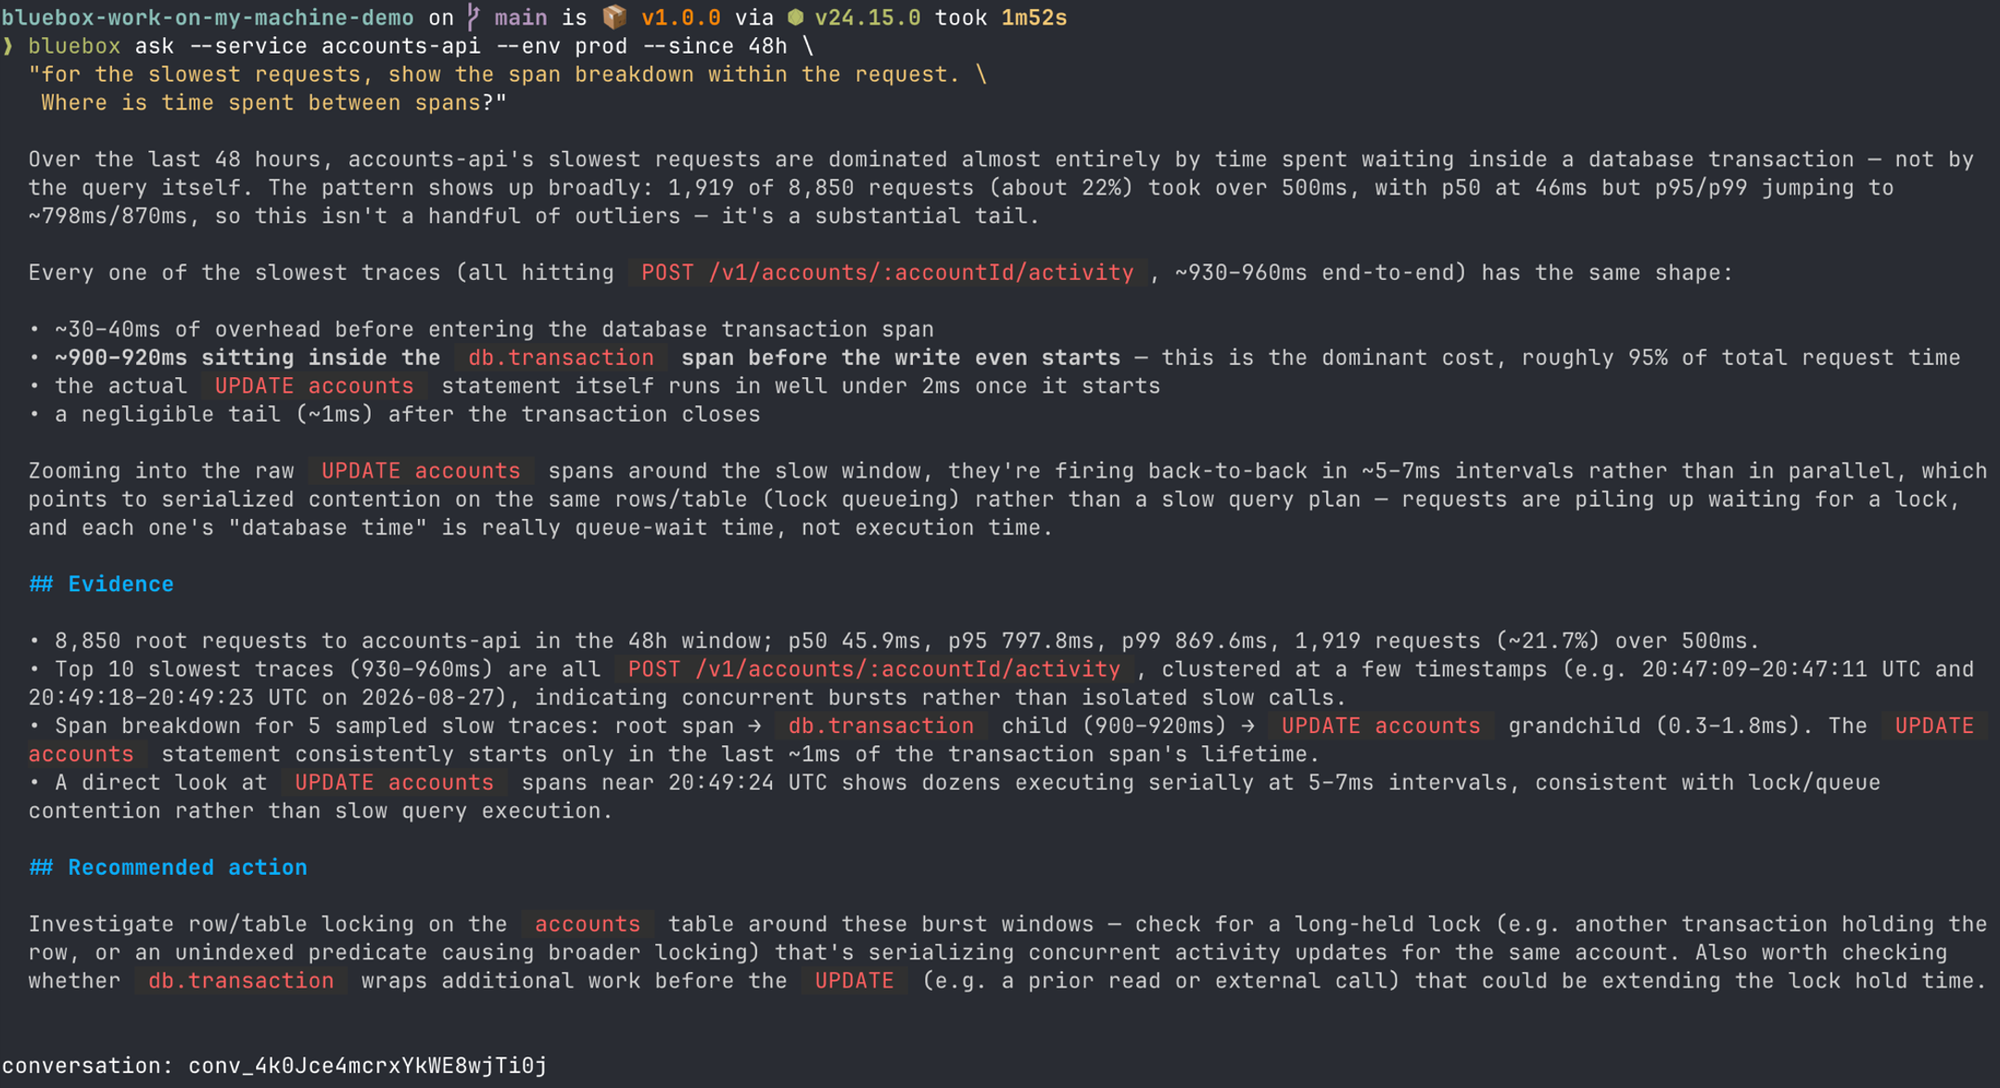
- 2 Second query: 100% of slow requests came from large-tier accounts. Zero from small-tier.
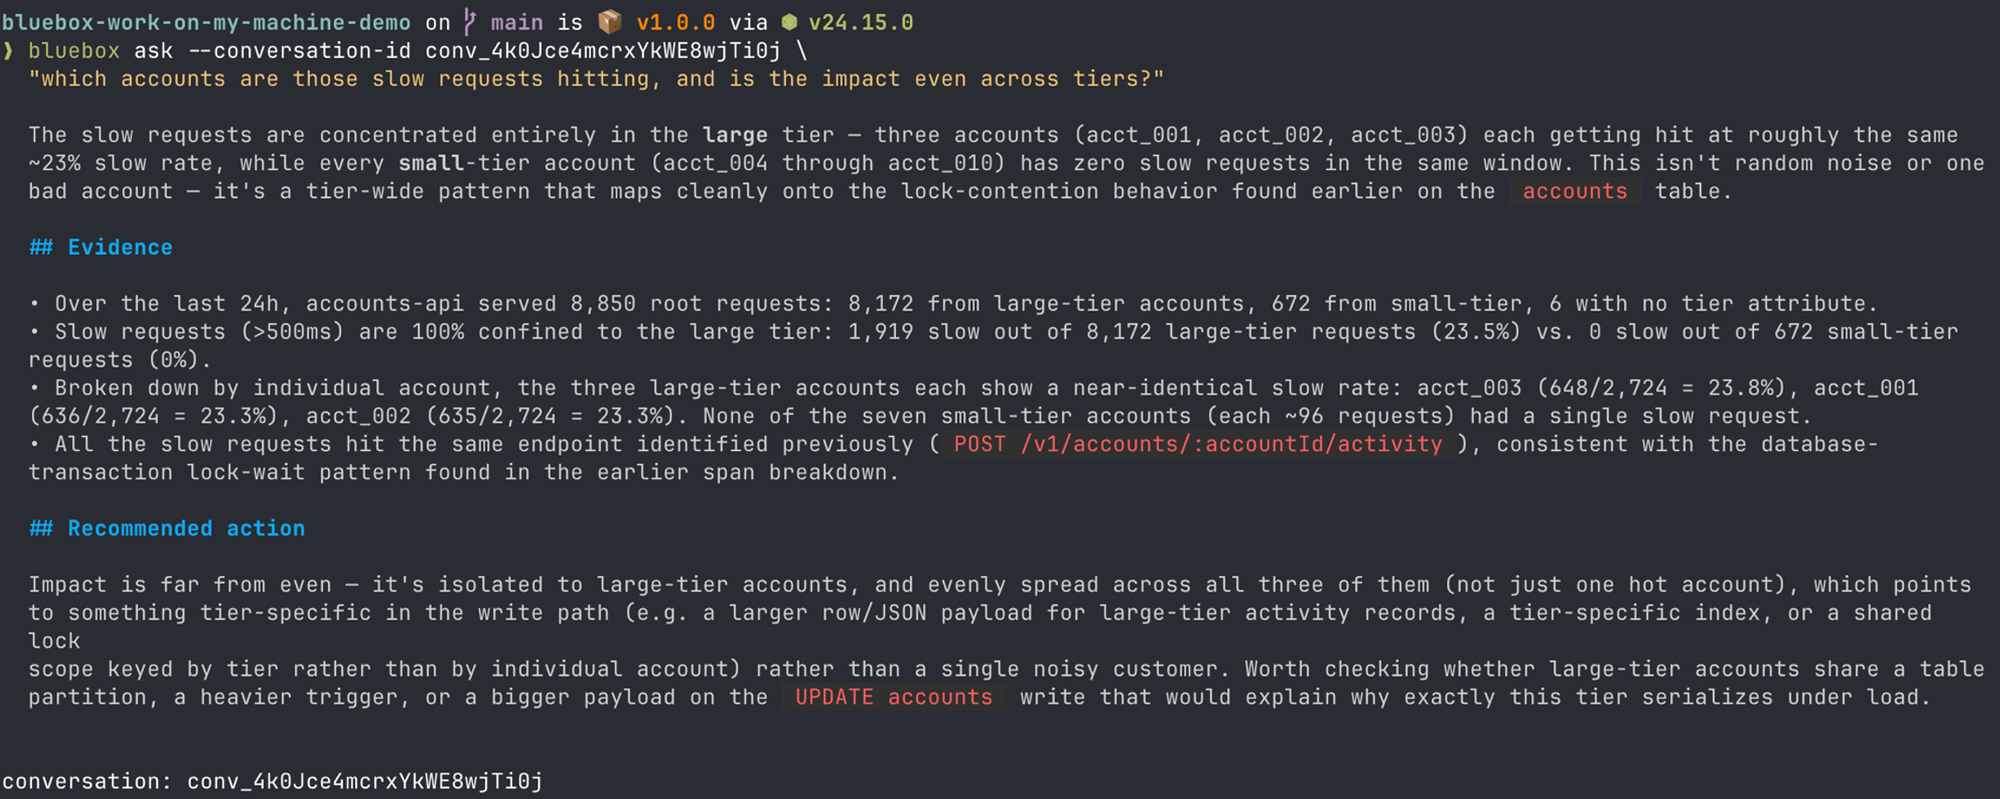
- 3 Third query: 28:1 request volume ratio per account between tiers. Lock contention follows traffic density, not tier flags.
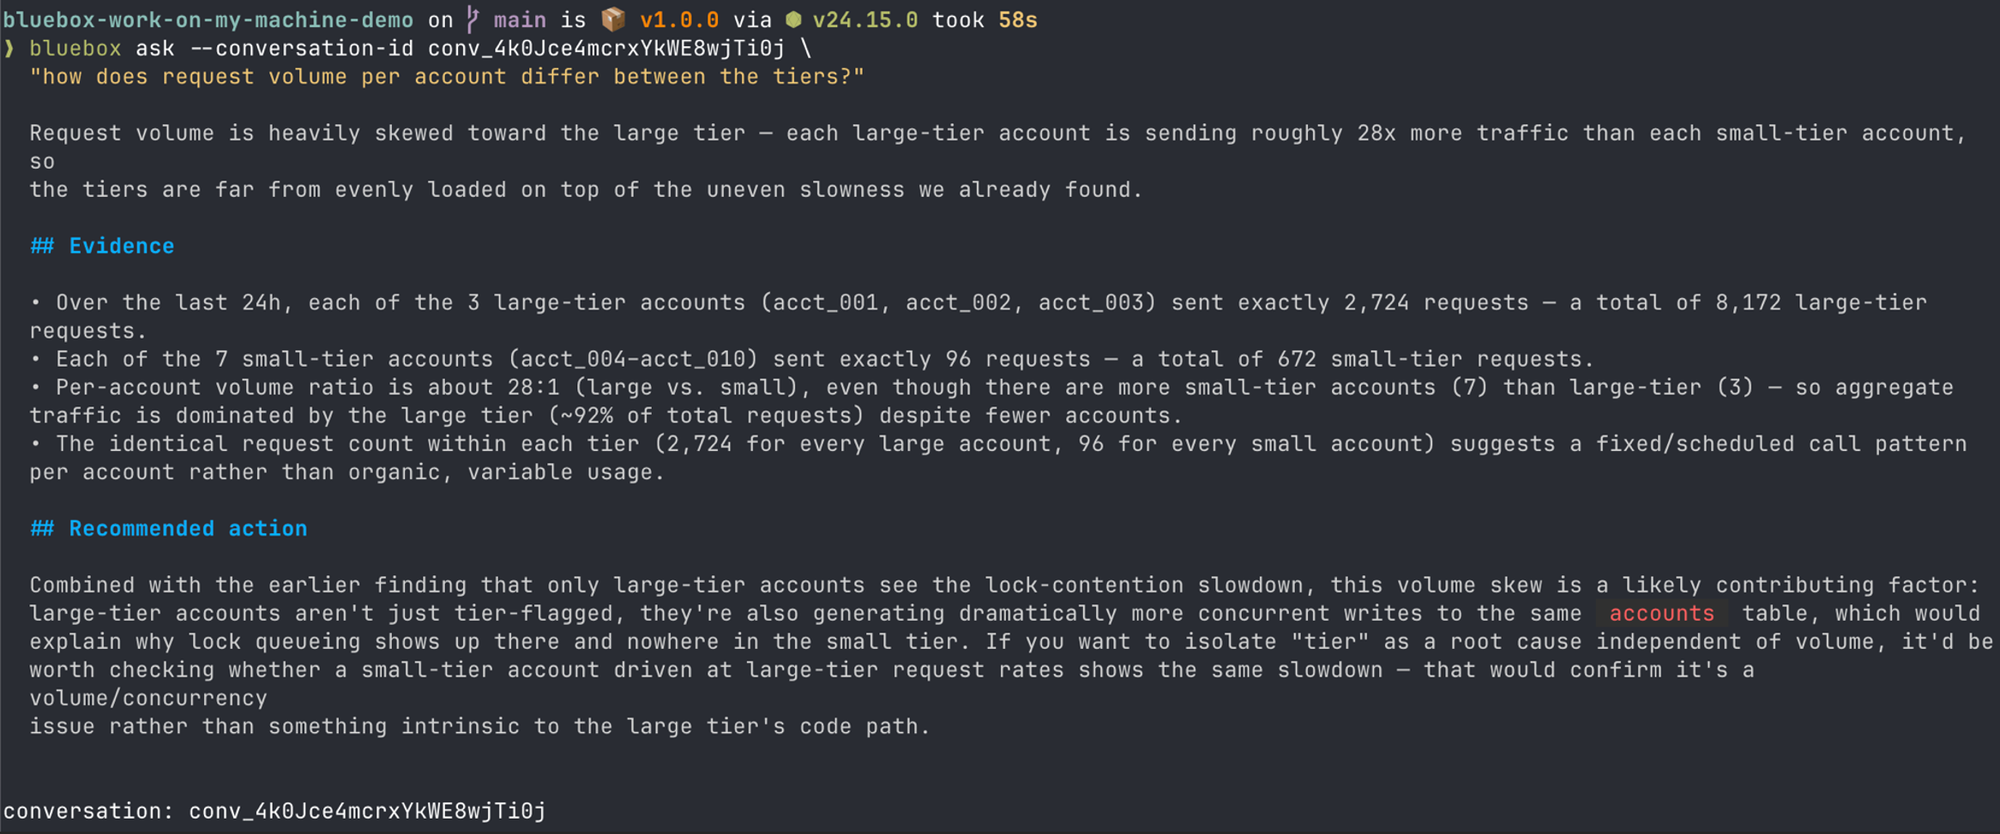
Bluebox corrected its own hypothesis between the 2nd and 3rd queries when the data did not support the initial explanation.
Result
03 Catch bugs your tests will never find
31 tests passed. Bluebox caught what they missed with live telemetry.
Problem 2 AI reviews caught 8 bugs. 31 unit tests passed. One runtime bug survived all of them.
What Bluebox did Queried live telemetry post-deploy. Found the missing event.source attribute.
Result 1 bug caught in production 31 tests caught 0
Catch bugs your tests will never find
31 tests passed. Bluebox caught what they missed with live telemetry.
2 AI reviews caught 8 bugs. 31 unit tests passed. One runtime bug survived all of them.
Queried live telemetry post-deploy. Found the missing event.source attribute.
Problem
Florian was extending an OpenTelemetry integration for openHAB, a home automation platform with no staging environment. He ran an architecture review before writing code and a code review after. 31 tests passed. The code shipped. Roughly half of all traced event types were silently missing their event.source attribute. The bug only appears when real events with null sources flow through a running system.
What Bluebox did
- 1 Verified signals were arriving after each implementation phase: logs, then metrics, then traces, then hardening. Not once at the end.
- 2 First query returned wrong: Bluebox had targeted a derived backend metric rather than the bundle's own metric names. It recognized the mismatch, explained why the result couldn't be trusted, and reframed. Second query confirmed 14+ metric families ingesting continuously.
- 3 Confirmed service identity across all three independently built pipelines: ~750 log entries and 4,275 spans sampled across 10 event types in a 15-minute window, all carrying byte-identical service.name, service.namespace, service.version, and service.instance.id.
- 4 Surfaced the bug: roughly half of event types were missing their event.source attribute. A null source was being passed unconditionally into the span. This failure mode only appears when real events with real null sources flow through a running system. 2 static reviews and 31 tests missed it.
- 5 Fix: one guard clause and two new tests.
Result
More use cases coming soon.
See Bluebox in action on your codebase.
Connect your repos in one command. No credit card required.